
Reusable Data Sources
Know the difference between embedded and reusable data sources

Building K12 Analytics Engineering alongside Zander is a very fulfilling experience for many reasons. I get to work with awesome data practitioners from education organizations all around the country, build a data platform that has deep impact in every organization we work with, and I get to continue working as a data practitioner myself. I spend most of the day directly working on data infrastructure, and often in BI platforms such as Looker Studio and Lightdash. It is my hope that this Substack becomes my place to share reflections and wonderings about the data engineering space.
Inaugural post, Looker Studio data sources! 🤣 They are often overlooked and not much time is spent thinking about them, and that is the problem! It is important to use data sources wisely so your Looker Studio instance scales and grows in a way that is easy to maintain.
1:1 BigQuery table and Looker Studio Data Source
A BigQuery table should only ever be connected to a single Looker Studio data source. This is about more than ensuring your field names and data types are consistent across reports that use the same BigQuery table. This is about ensuring your metrics and their definitions are consistent and easy to maintain!
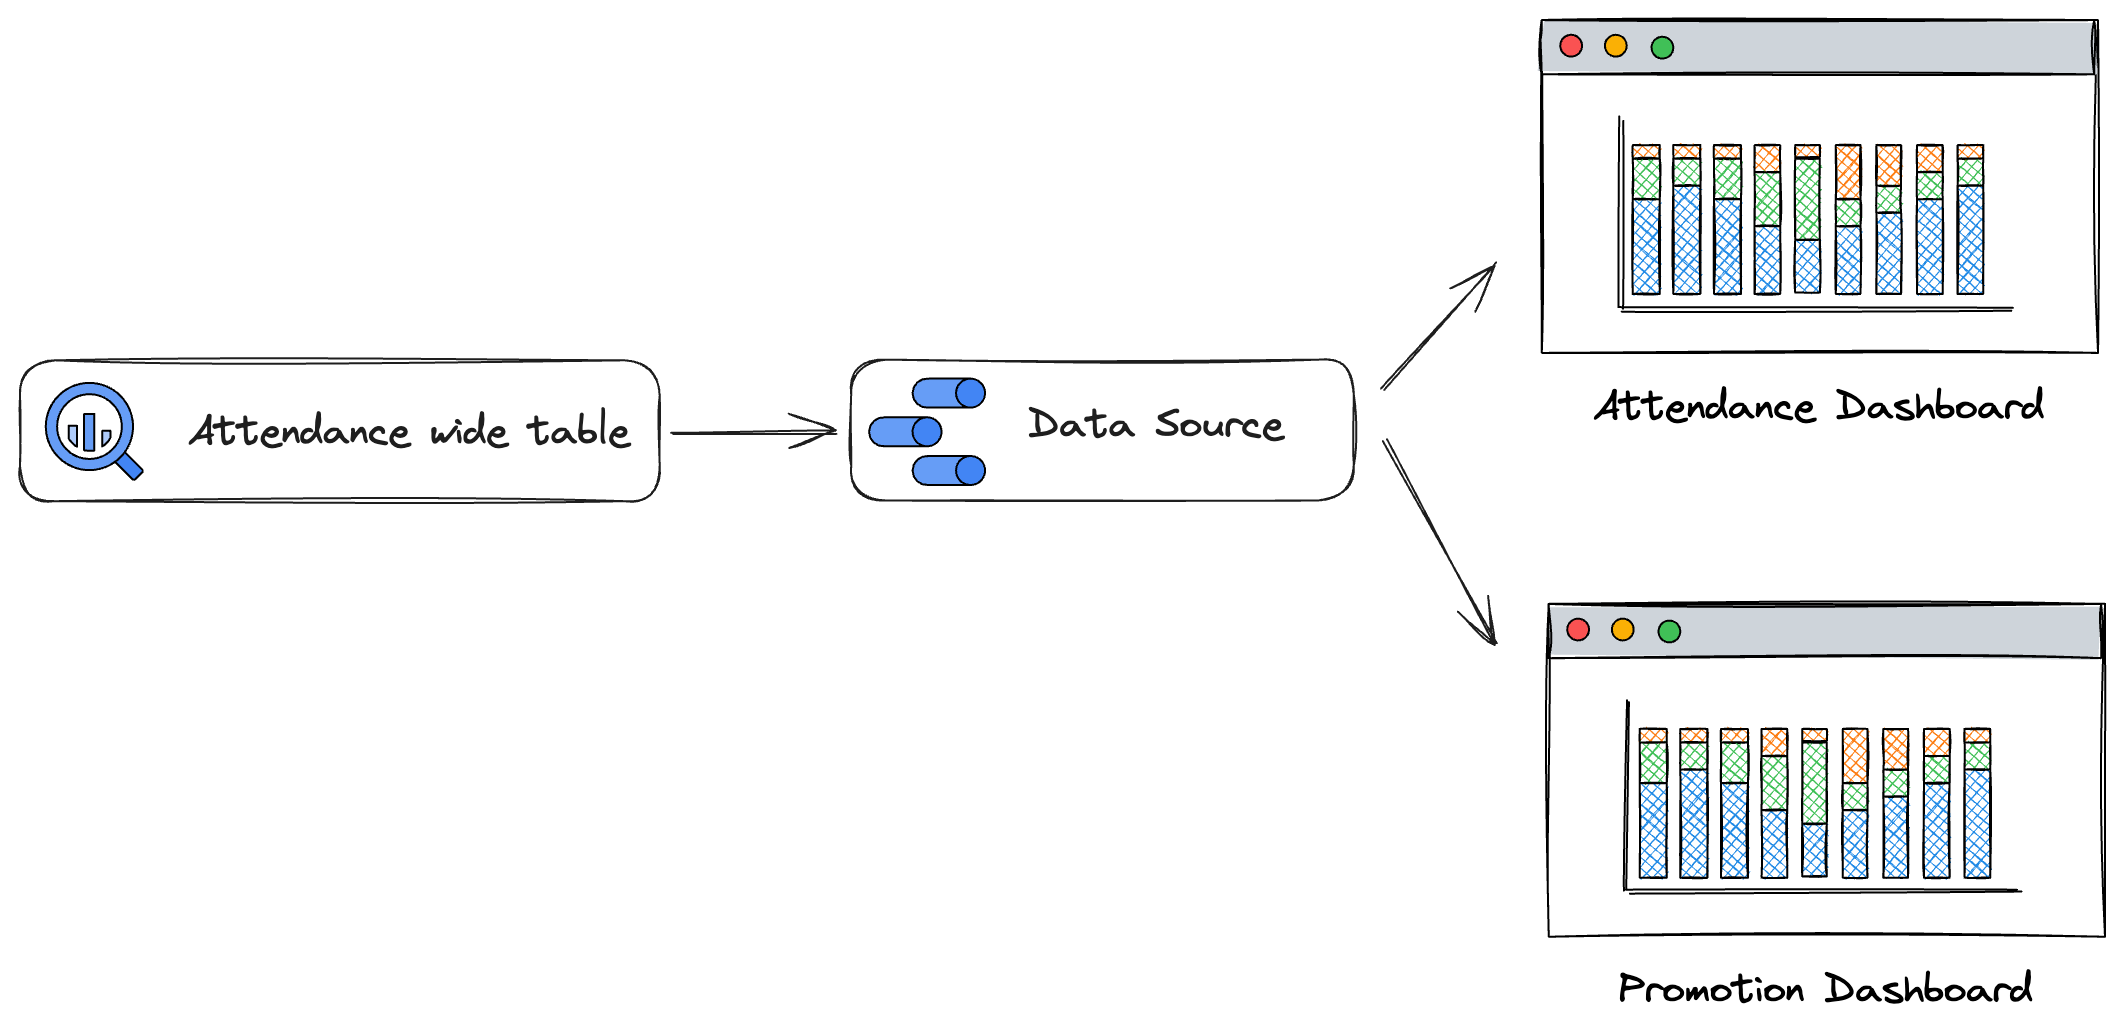
Let’s imagine that you have a BigQuery table, wide_student_school_attendance, that contains students’ daily attendance. If you use K12 Analytics Engineering, you very likely already have this table. Let’s say this table is one row per student per instructional day enrolled. If a student has been enrolled for 102 days this school year, they have 102 rows. Got it? Great!
This dataset contains various measures (ie attendance_code, absence_duration and attendance_duration). Measures by themselves do not provide us with very much information compared to the stories we can tell with metrics. It is when we aggregate data applying some calculation that we start to tell a story that is deeper and more meaningful.
Average Daily Attendance (or Attendance Rate) is a metric we see at all organizations we work with. ADA is the sum of attendance divided by the number of membership days. If a student has been enrolled for 102 days and was in attendance for 95 of them, their ADA is 93% (95 / 102).
To build this metric into Looker Studio, we would use a calculated field and it would look something like this:
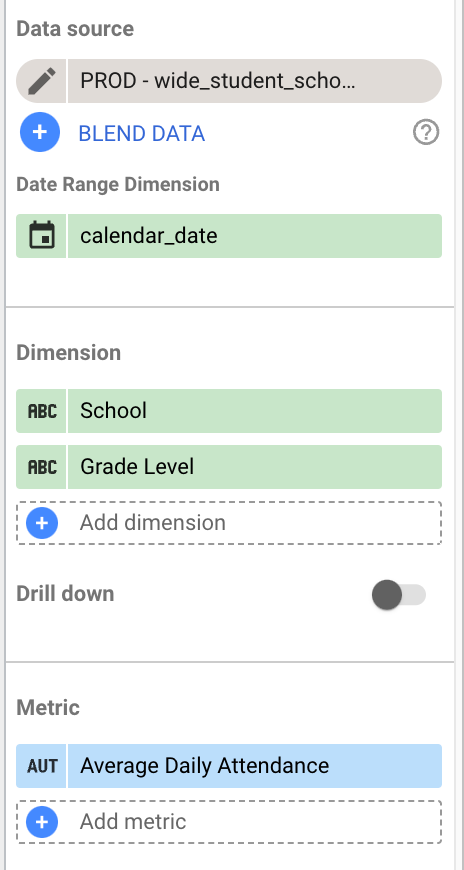
sum(attendance_duration) / Record CountJust like that, we can create charts and tables that look at ADA in a variety of ways. Below is a chart configuration that looks at ADA by school and grade level. School and grade level are exactly where we’d want them, as dimensions. ADA is our metric and is correctly listed under Metric.
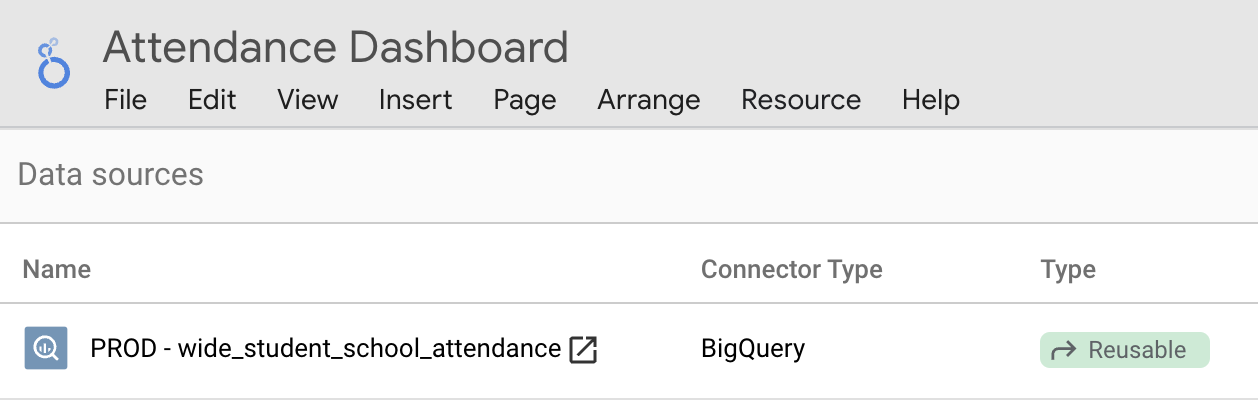
Let’s go back to the theme of this article, reusable data sources. Under Manage Data Sources, you will want to ensure that the data source for attendance is set to Reusable. This will allow it to be added to additional dashboards. When you add the data source to an additional dashboard, your metrics are already there! You are ready to start using them and building your dashboard. Amazing!
Did you enjoy this post? Consider subscribing, leaving a comment, or checking out K12 Analytics Engineering!